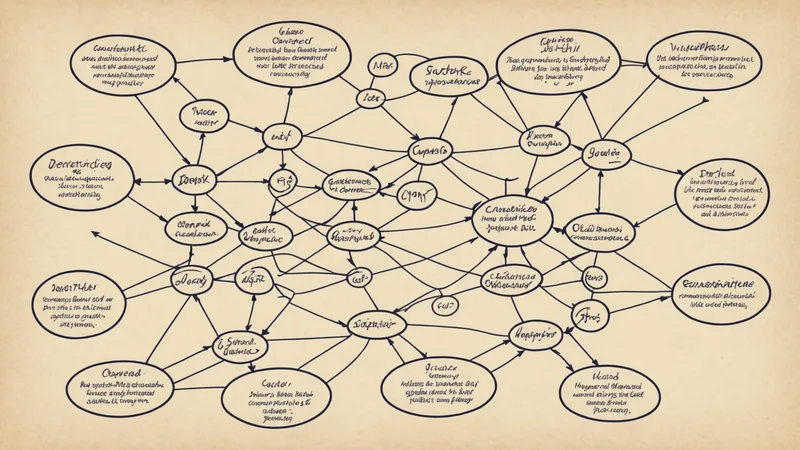
Open any K-12 math textbook and look at the table of contents. You will find a list of topics organized roughly by increasing complexity: arithmetic, then fractions, then ratios, then proportional reasoning, then algebra, then geometry, then functions. This sequence is not arbitrary -- it reflects a genuine dependency structure. Topics later in the list depend on earlier ones.
But the table of contents only shows the surface of that structure. It shows chapter-level dependencies. What it does not show is the more granular dependency graph underneath: which specific concept within fractions is required for which specific element of ratio reasoning. That finer-grained structure is what determines whether a student can successfully learn a new topic, and it is almost never made explicit in the curriculum materials teachers use.
The difference between sequence and dependency
Not every topic that appears before another one in a curriculum is a genuine prerequisite for it. Some topics are sequenced for organizational reasons -- because they are typically taught at a particular grade level -- rather than because they are structurally required to understand what comes next. A curriculum that introduces probability in fifth grade and statistics in seventh grade is not necessarily making a claim that students need probability to understand statistics; it might just be a pacing convention.
Genuine prerequisite relationships are structural: you cannot understand concept B if you do not have concept A, because the definition or procedure of B requires operating on something that concept A introduces. Fraction division is a genuine prerequisite for proportional reasoning because proportion problems frequently require dividing quantities and representing the result as a fraction. This is not just a "we cover fractions first" convention; it is a cognitive dependency.
When building a diagnostic system that aims to detect prerequisite gaps, the distinction matters enormously. If you treat every earlier topic as a prerequisite for every later one, you end up probing students on concepts that are not actually blocking them, wasting time on diagnostics that do not move the needle. If you only probe genuine structural prerequisites, you can do effective gap detection with a surprisingly small number of questions.
How a prerequisite dependency graph is constructed
Building a precise prerequisite graph requires starting from the target topic -- the one the student is about to be taught -- and working backwards. The question to ask at each step is: what must a student be able to do (or understand) to successfully engage with the new material, not just procedurally, but at the level of conceptual understanding required to apply the skill in new contexts?
For linear equations in one variable, the most critical prerequisites are: understanding that a variable represents an unknown quantity (not just a "letter to solve for"), ability to apply inverse operations to isolate a term, and comfort with signed arithmetic including negative numbers. A student who can execute the algebraic procedure of solving 2x + 3 = 11 through memorized steps but cannot explain why subtracting 3 from both sides is valid is showing procedural competence without the conceptual underpinning -- and this student will fail when the procedure needs to be adapted to a novel form.
The graph is constructed by repeating this analysis for each prerequisite concept, recursively. What does "ability to apply inverse operations" depend on? It depends on understanding the relationship between addition and subtraction, and between multiplication and division -- which in turn depends on a solid mental model of what those operations mean. The recursion eventually bottoms out at foundational arithmetic concepts that are not themselves composed of more elementary prerequisites.
Where the graph gets complicated
The dependency graph for K-12 math is not a simple tree. Many target concepts have multiple independent prerequisite chains, and some concepts appear as prerequisites on multiple branches. Fraction understanding is a prerequisite for ratio reasoning, for decimal arithmetic, for percentage problems, for proportional reasoning, and for early algebraic thinking about rational numbers. This means that a single gap -- say, a weak understanding of the meaning of the denominator in a fraction -- can cause difficulties across a wide range of later topics through multiple independent pathways.
It also means that the graph can help prioritize intervention. A gap in a node that is a prerequisite on many downstream branches is more urgent than a gap in a node that is only a prerequisite for one specific later topic. This is not the same as saying the second gap does not matter -- it does, to the student who needs that topic -- but from a resource allocation standpoint, closing a high-connectivity prerequisite gap has broader leverage.
The graph also has to account for the depth of prerequisite chains. Some topics have shallow prerequisites -- they depend on one or two earlier concepts that are themselves not heavily dependent on other prerequisites. Other topics have deep chains where you may need to trace back four or five steps to find the original gap. Algebra readiness is a famously deep chain, which is why algebra is such a common stumbling point: by the time a student hits it, there are many possible places the prerequisite chain could have broken.
Using the graph for targeted detection
Once you have the graph, the diagnostic design becomes much more tractable. Instead of trying to assess a student's general math ability (which requires many questions to get a reliable measure), you can probe the specific nodes on the prerequisite chain of the next topic they will learn. This requires far fewer questions -- typically five to eight well-designed items per prerequisite node -- because you are not trying to estimate a broad ability level; you are trying to determine whether a specific concept is solid or shaky.
The detection threshold is also different from traditional assessment. You are not trying to determine mastery in the assessment sense -- you do not need to know whether a student scores 85% or 92% on fraction division. You need to know whether their understanding is reliable enough to serve as a foundation for the next concept. A student who gets six out of eight targeted fraction division items right in a pattern that suggests consistent understanding is probably ready. A student who gets six out of eight right but whose error pattern shows that two of the errors are systematic rather than random is showing a different picture -- the systematic errors indicate a conceptual gap that will cause problems downstream, even though the surface score looks similar.
This is what makes prerequisite-graph-based diagnostic design fundamentally different from scoring-based approaches. The graph tells you what to look for; the diagnostic items probe for it; the interpretation of the result is about pattern and consistency, not raw score. It requires more careful question design and more structured interpretation, but it produces actionable information that a raw score cannot.